
Management Summary
Calculating the company‑specific share of recycling paper in corrugated packaging is becoming increasingly important due to rising regulatory requirements, transparency obligations, voluntary reporting, and cost‑optimization targets. This guide illustrates—using a structured approach—how external industry standards, especially grade lists, flute types, and insertion factors, can be combined with a company’s internal data to determine the actual paper consumption.
It explains step by step how grammages, flute geometries, and consumption volumes can be used to derive reliable statements about the proportions of virgin fiber and recycled papers, enabling a transparent, data‑based assessment of a company’s corrugated board demand. A sample calculation demonstrates the practical application.
Corrugated board is the dominant packaging material in the B2B environment. It is lightweight, robust, recyclable—and thus increasingly at the center of cost management, sustainability strategies, and reporting obligations.
With the CSRD and the ESRS standard E5, many companies must report their material use in packaging transparently for the first time. Corrugated board plays a central role: it is the most widely used packaging material in the B2B environment, yet its actual underlying paper‑demand structure is often not obvious.
Many companies know that a high share of recycling paper is used. However, only few can accurately quantify,
This article provides a practical and transparent explanation of how you can calculate your own material use and recycling paper share in corrugated packaging.
At HGS, we regularly conduct such calculations for our clients. Below, we outline the approach using a concrete example.
The Key Question
What is the quantity and percentage of recycling papers used in the company‑specific demand for corrugated packaging?
UAnd accordingly:
The Basic Principle of the Calculation
1. External Data
These data sets are publicly available and widely recognized in the industry::
These external parameters ensure that the calculation is comparable, transparent, and auditable.
2. Internal Data (Company‑Specific)
For each corrugated packaging item, the following information is required:
Best practise: Even using only a few key articles often yields a very reliable overall picture.
Why the Flute Type Matters
A common mistake in practice: corrugated board is treated as if it were a “flat” sheet of paper. In reality, the fluted medium requires additional material due to its geometry.
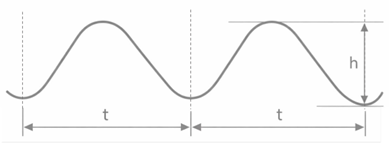
The Take-up Factor
The so called take-up factor (w) describes this additional paper requirement. It is derived from:
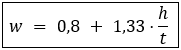
based on the VDW standard and can be calculated using the Tenzer formula:
w = 0,8 + 1,33 · (h / t)
The result is a dimensionless factor, for example:
Interpretation: For B flute, approximately 42% more fluting paper is required compared to a flat paper web of the same area.
Because flute geometries vary from manufacturer to manufacturer, the calculations represent an average based on VDW standards.
A list of take-up factors for all common flute types—calculated by HGS—along with the corresponding derivation is provided at the end of the article.
Step 1: Preparing Your Internal Data
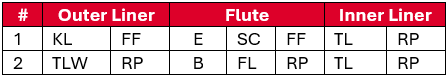
Manufacturers often provide the papers used for each packaging item in formats such as:
The bold marked elements indicate the flute types. The remaining elements describe the paper grades and their grammages in g/m².
These components must be structured per article. The individual papers are then classified as virgin fiber (VF) or recycling paper (RP) based on the grade list.
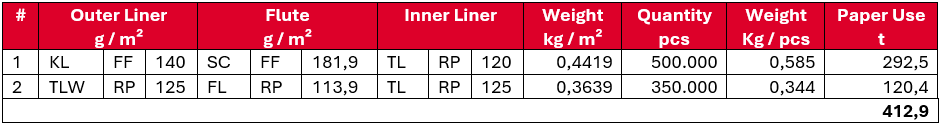
Step 2: Determining Paper Demand per Square Meter
This yields the paper weight per m² of corrugated board:
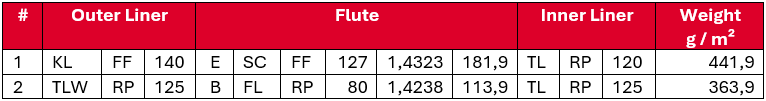
Note: For multi flute boards, additional flutes and intermediate liners must be added accordingly.
Step 3: Determining Weight Shares per Paper Layer
For each article, the weight of each layer is calculated as a percentage of the article’s total paper weight.
Example article #1 inner liner: 120 / 441.9 = 27.1%.
Result:
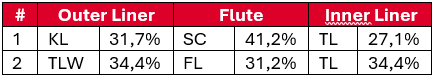
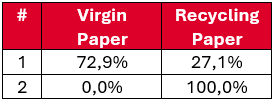
These shares remain constant for each article as long as the construction (paper grades, grammages, flute type) remains unchanged — independent of quantity.
Step 4: Calculating Paper Use During the Reporting Period
To move from the per-unit paper values of an individual article to the paper use per article for the entire reporting period, and from there to the total paper consumption across all articles, the weight in kg per unit must be multiplied by the quantity used during the reporting period.
Example for Article #1:
0.585 kg/pcs × 500,000 pcs = 292,500 kg = 292.5 t
Across both articles in the example, total paper use in the reporting period is 412.9 t.
Step 5: Calculating Layer‑Specific Quantities in the Reporting Period
For each article, the paper use in the reporting period is multiplied by the percentage share of each layer (determined in Step 2). This yields, for every article, the tonnage of each paper layer used during the reporting period.
Example for Article #1: 292.5 t × 27.1% (inner liner share) = 79.3 t
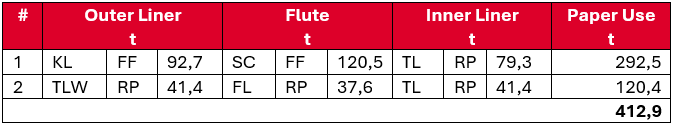
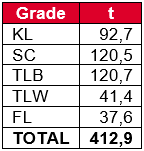
Summing the articles yields the total paper quantity (in tonnes), broken down by
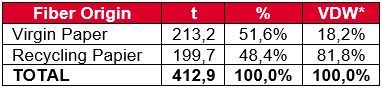
*Industry average according to VDW (2024)
Result: A Reliable Recycling paper Share
The outcome is a clear key figure:
Recycling paper share of total corrugated board demand (in %)
In this example, the recycling paper share is 48.4%, significantly below the industry average of 81.8%.
This key figure is:
Typical Use Cases of the Results
Companies use this calculation method for various purposes, including:
Conclusion
The recycling paper share in corrugated board packaging can be calculated without black box models—provided that external industry standards and internal consumption data are cleanly linked.
Companies that apply this methodology:
Contact HGS for further information: info@hgs-info.net
Thomas Kollodzey, Handelsgesellschaft Sparrenberg mbH, Brokstraße 77, 33605 Bielefeld
Graphics and Tables
European List of Corrugated Base Papers
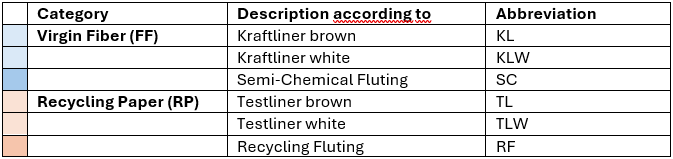
High Performance Papiere wurden aus Gründen der Vereinfachung dem jeweiligen Basispapier (TL, TLW, WS) zugeordnet.Gleiches gilt für gestrichene Papiere, die in KLW und TLW eingehen.Sollten Sie Offset bedruckte Artikel einsetzen, die in der Decke einen GD-Karton verwenden, kann die Sortenliste bei den Recyclingpapieren um einen GD-Karton erweitert, oder die Mengen hilfsweise dem TLW zugeordnet werden.
Calculation of the Take-up Factor According to Tenzer
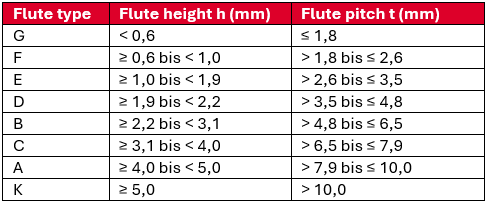
The VDW flute table provides upper and lower boundaries for flute height and pitch (VDW 2015).
Tenzer Formula (Definition and Application)
The formula originates from H.-J. Tenzer, Professor of Paper Processing Technology at TU Dresden, and has been an established calculation basis in the paper and corrugated board industry for decades (Tenzer, 1989).
Where:
The constant 0.8 represents the baseline material requirement, while 1.33 captures the geometric impact of the flute (ratio h/t).
Values for flute height and pitch per flute type are inserted directly into the Tenzer formula.
Example Calculation: B‑Flute
VDW boundary values (2015):
Insert into the Tenzer formula:
w"B" = 0,8 + 1,33 · 2,65 / 5,65 = 0,8 + 1,33 · 0,4690 = 0,8 + 0,6238 = 1,4238
The table below shows the average take-up factor for the flute types according to the ‘List of Flute Types’ (VDW 2025), calculated by HGS using the Tenzer formula (Tenzer 1989).
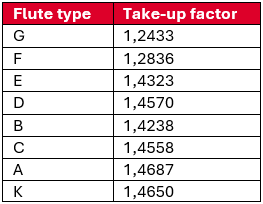
Calculated according to: Tenzer, Hans-Jürgen (1989): Leitfaden der Papierverarbeitungstechnik. Fachbuchverlag Leipzig. 1. Auflage. ISBN 3 343 00448 0.
Methodological note (open boundaries, '<' and '≥'):
In the VDW flute list, some flute types contain open boundaries (e.g., G: h < 0,6; K: t > 10,0). For a standardized and reproducible calculation, HGS applies the listed boundary value as the basis (e.g., for 'h < 0,6', h = 0,6). This is a conservative assumption, meaning the calculated take-up factor may be slightly overestimated if the real value lies below or above the boundary.
Sources Used:
(VDW 2015)
VDW – Verband der Wellpappen-Industrie e. V.
Verband der Wellpappen-Industrie e. V. (2015): Wellenarten nach VDW (Stand 2015).
PDF-Download:https://www.wellpappe-wissen.de/data/downloads/wellenarten_2015_1.pdf
(VDW 2025)
VDW – Verband der Wellpappen-Industrie e. V.
VDW – Verband der Wellpappen-Industrie e. V. (2025): Jahresbericht 2024/2025
Zitiert im Dokument: S. 5-7
PDF-Download:https://wellpappen-industrie.de/wp-content/uploads/2025/05/VDW_Wellpappe_Jahresbericht_2025_WEB.pdf
(Containerboard Europe 2025)
Containerboard Europe (vormals Cepi ContainerBoard)
Containerboard Europe (2025): European List of Corrugated Base Papers, deutsche Fassung, S. 19.
PDF-Download:https://containerboardeurope.org/wp-content/uploads/2025/06/European-List-of-Corrugated-Base-Papers-German.pdf
(Tenzer 1989)
Tenzer, Hans-Jürgen (1989): Leitfaden der Papierverarbeitungstechnik. Fachbuchverlag Leipzig. 1. Auflage.
ISBN 3 343 00448 0.
URL:https://books.google.com/books/about/Leitfaden_der_Papierverarbeitungstechnik.html?id=hBClAAAACAAJ